| survival | sex | age | agegroup | pclass | fare | family |
|---|---|---|---|---|---|---|
| Survived | Female | 24.0000 | Adult | First | 69.3000 | 0 |
| Died | Male | 24.0000 | Adult | Third | 7.7958 | 0 |
| Survived | Male | 0.9167 | Child | First | 151.5500 | 3 |
| Died | Male | 60.0000 | Adult | First | 26.5500 | 0 |
Understanding Data
Sociology 312/412/512, University of Oregon
What Does Data Look Like?
Most data looks like a spreadsheet
- Observations are on the rows. Observations are the units from which you are taking measurements.
- Variables are on the columns. Variables measure specific attributes of your observations.
The unit of analysis
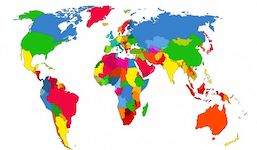
The unit of analysis simply tells you what your observations are. We can collect data on many different types of units.
Some examples, but the possibilities are endless:
| Individual People | Countries | Corporations | Universities |
|---|---|---|---|
 |
 |
 |
 |
What is the unit of analysis?
- Titanic data on passengers?
- Cross-national data on CO2 emissions?
Titanic: Individual Passengers 
Cross-national data: Countries 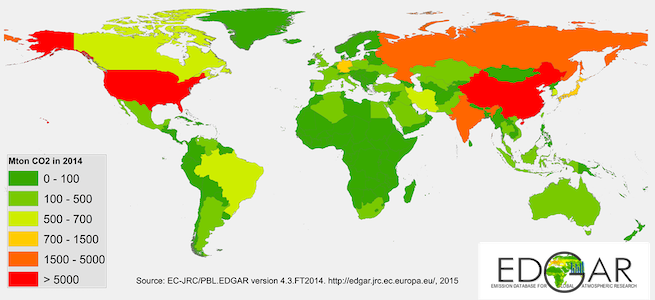
Quantitative variables
A quantitative variable measures quantities of something. A quantitative variable is always represented as a number. There are two types of quantitative variables.
Discrete
A discrete variable can only take certain values within a range.
- Number of children ever had
- Number of violent crimes committed
- Number of siblings
- Number of Youtube views
Continuous

A continuous variable can take any value within a given range.
- Age
- Height
- GDP per capita
- CO2 emissions
Categorical variables
Categorical variables indicate which category an observation belongs to from a mutually exclusive set of categories. There are also two types of categorical variables:
Ordinal
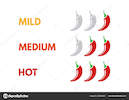
An ordinal variable is a categorical variables whose values have a clear ordering.
- Highest degree earned
- passenger class on the Titanic
- level of support with an opinion statement
Nominal

A nominal variable is a categorical variable whose values are unordered.
- Gender
- Race
- Political party
What variables types do we have?
| survival | sex | age | agegroup | pclass | fare | family |
|---|---|---|---|---|---|---|
| Survived | Female | 24.0000 | Adult | First | 69.3000 | 0 |
| Died | Male | 24.0000 | Adult | Third | 7.7958 | 0 |
| Survived | Male | 0.9167 | Child | First | 151.5500 | 3 |
| Died | Male | 60.0000 | Adult | First | 26.5500 | 0 |
- survival: survival is a nominal variable.
- sex: sex is a nominal variable.
- age: age is a continuous variable.
- agegroup: age group is an ordinal variable.
- pclass: Passenger class is an ordinal variable.
- fare: fare paid is a continuous variable (sort of).
- family: number of family members is a discrete variable.
What Can We Do With Data?
Look at the distribution of a variable
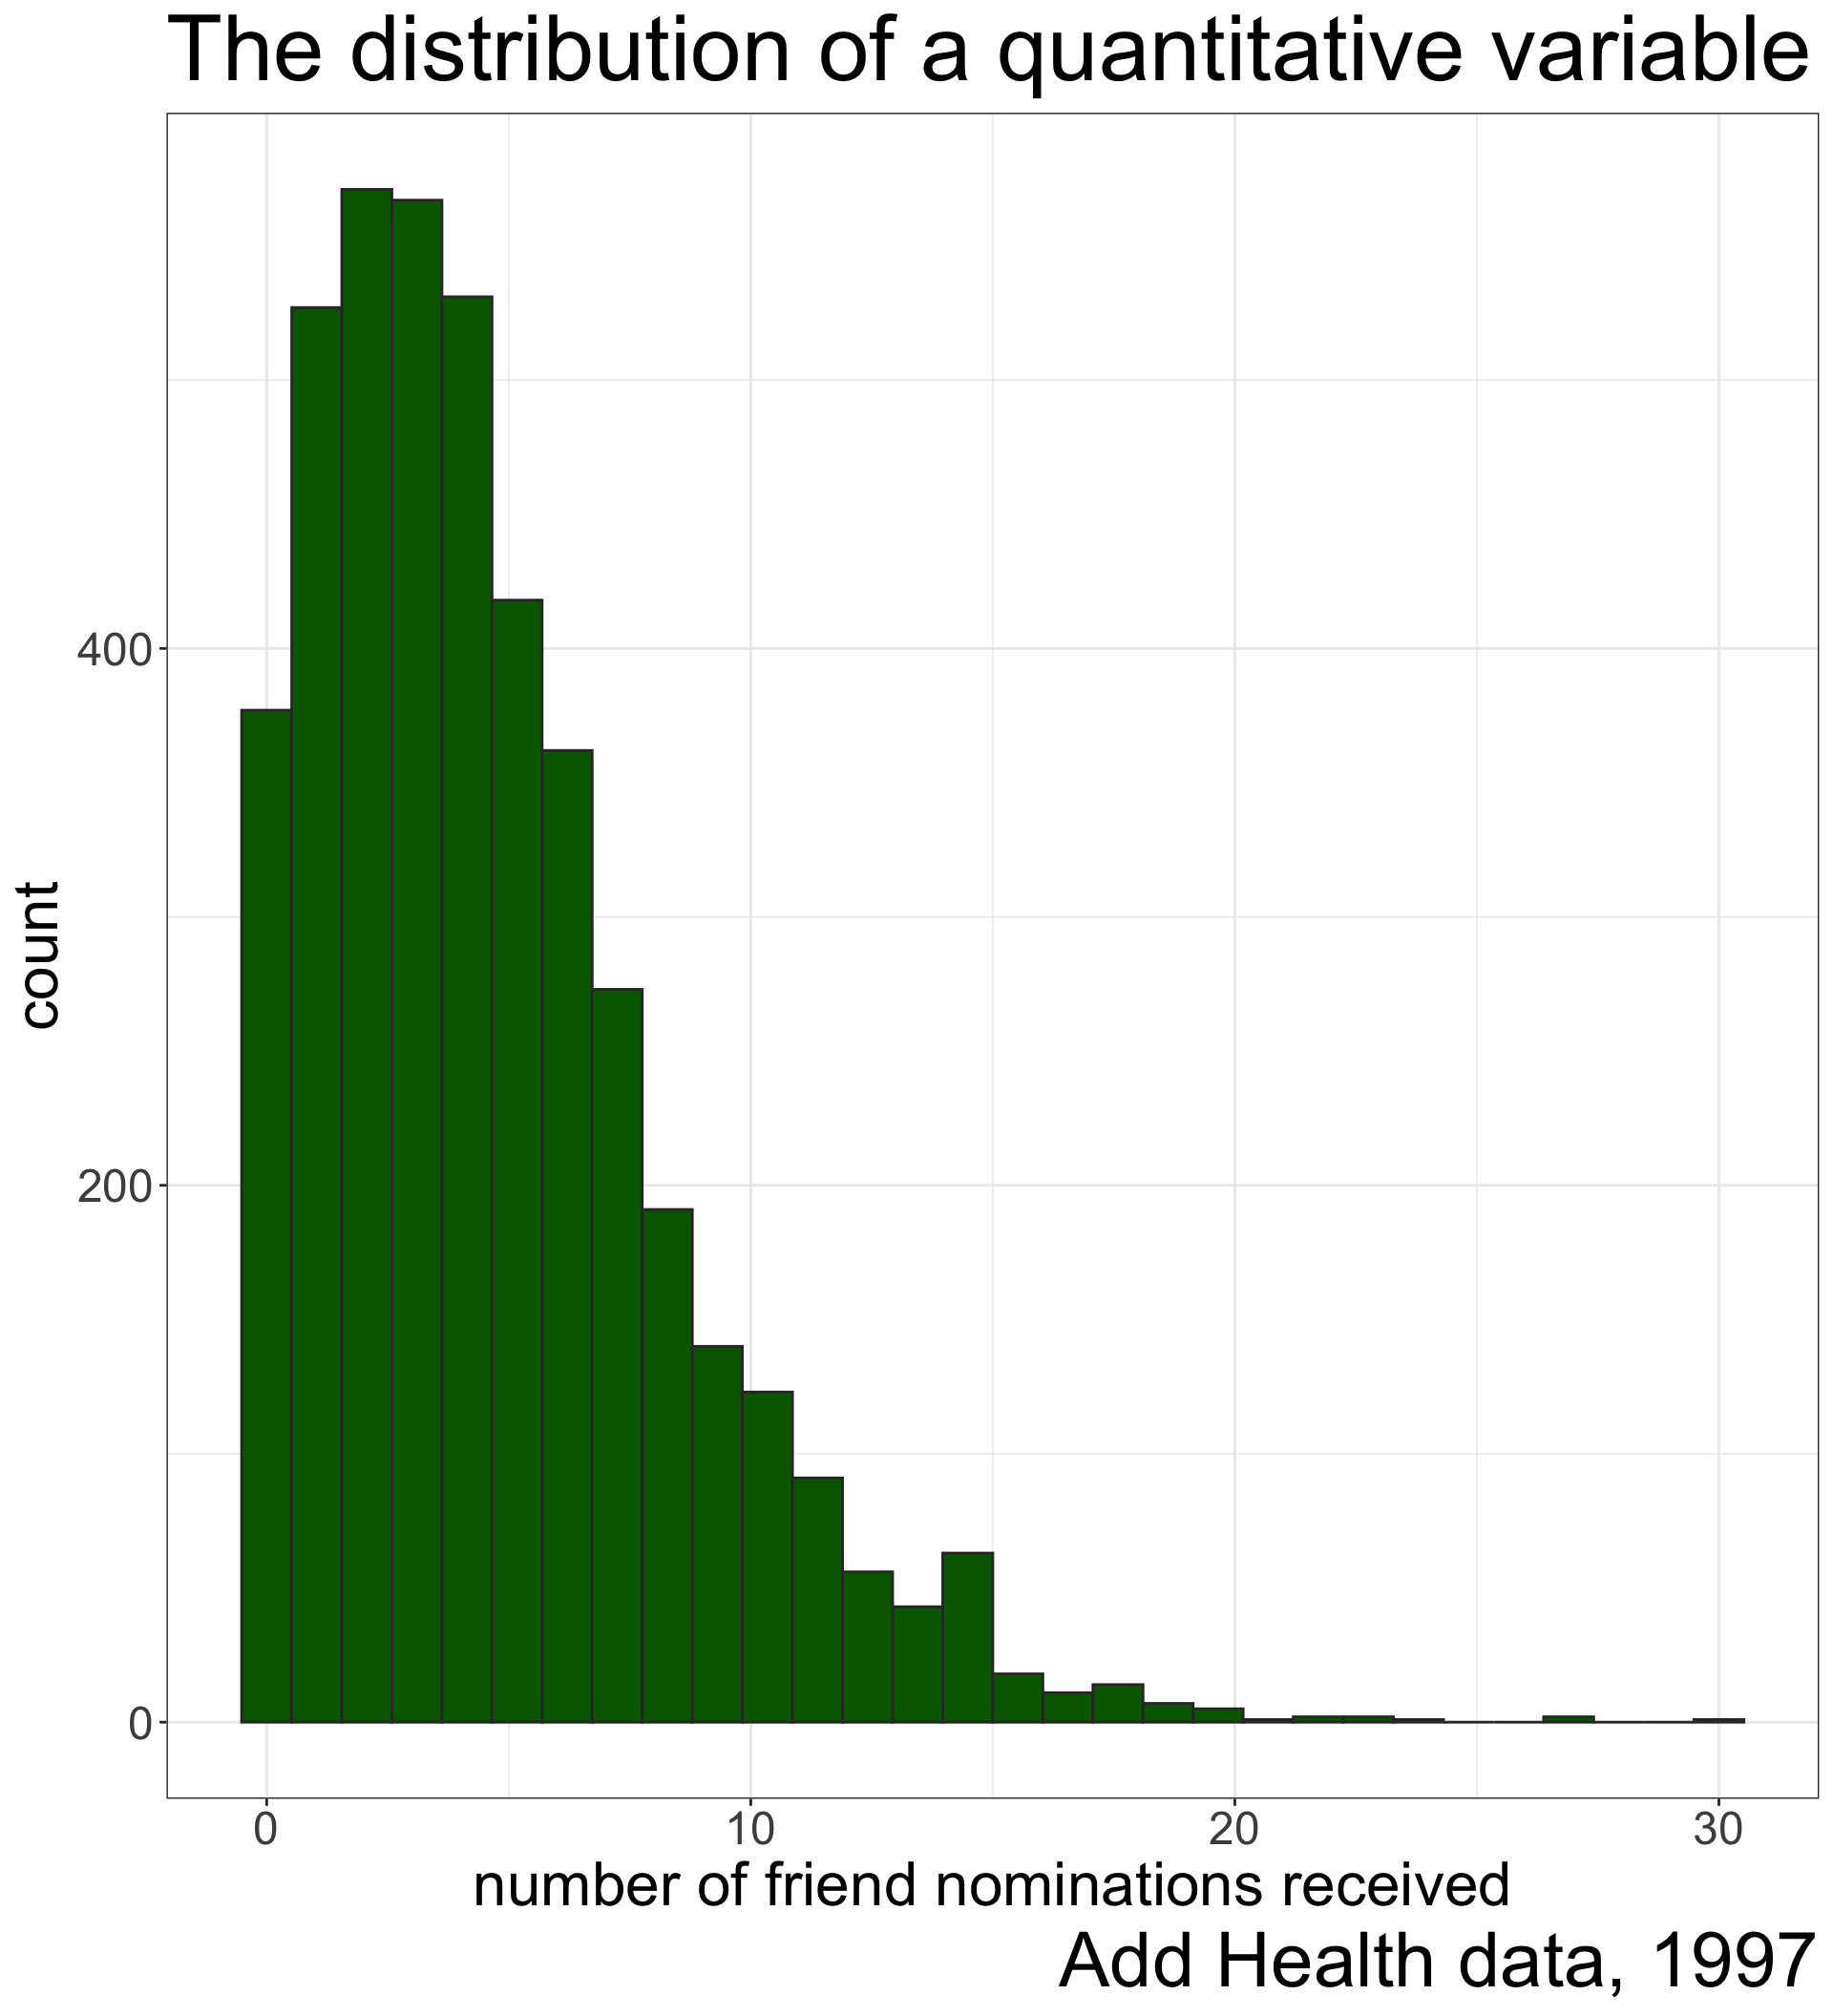
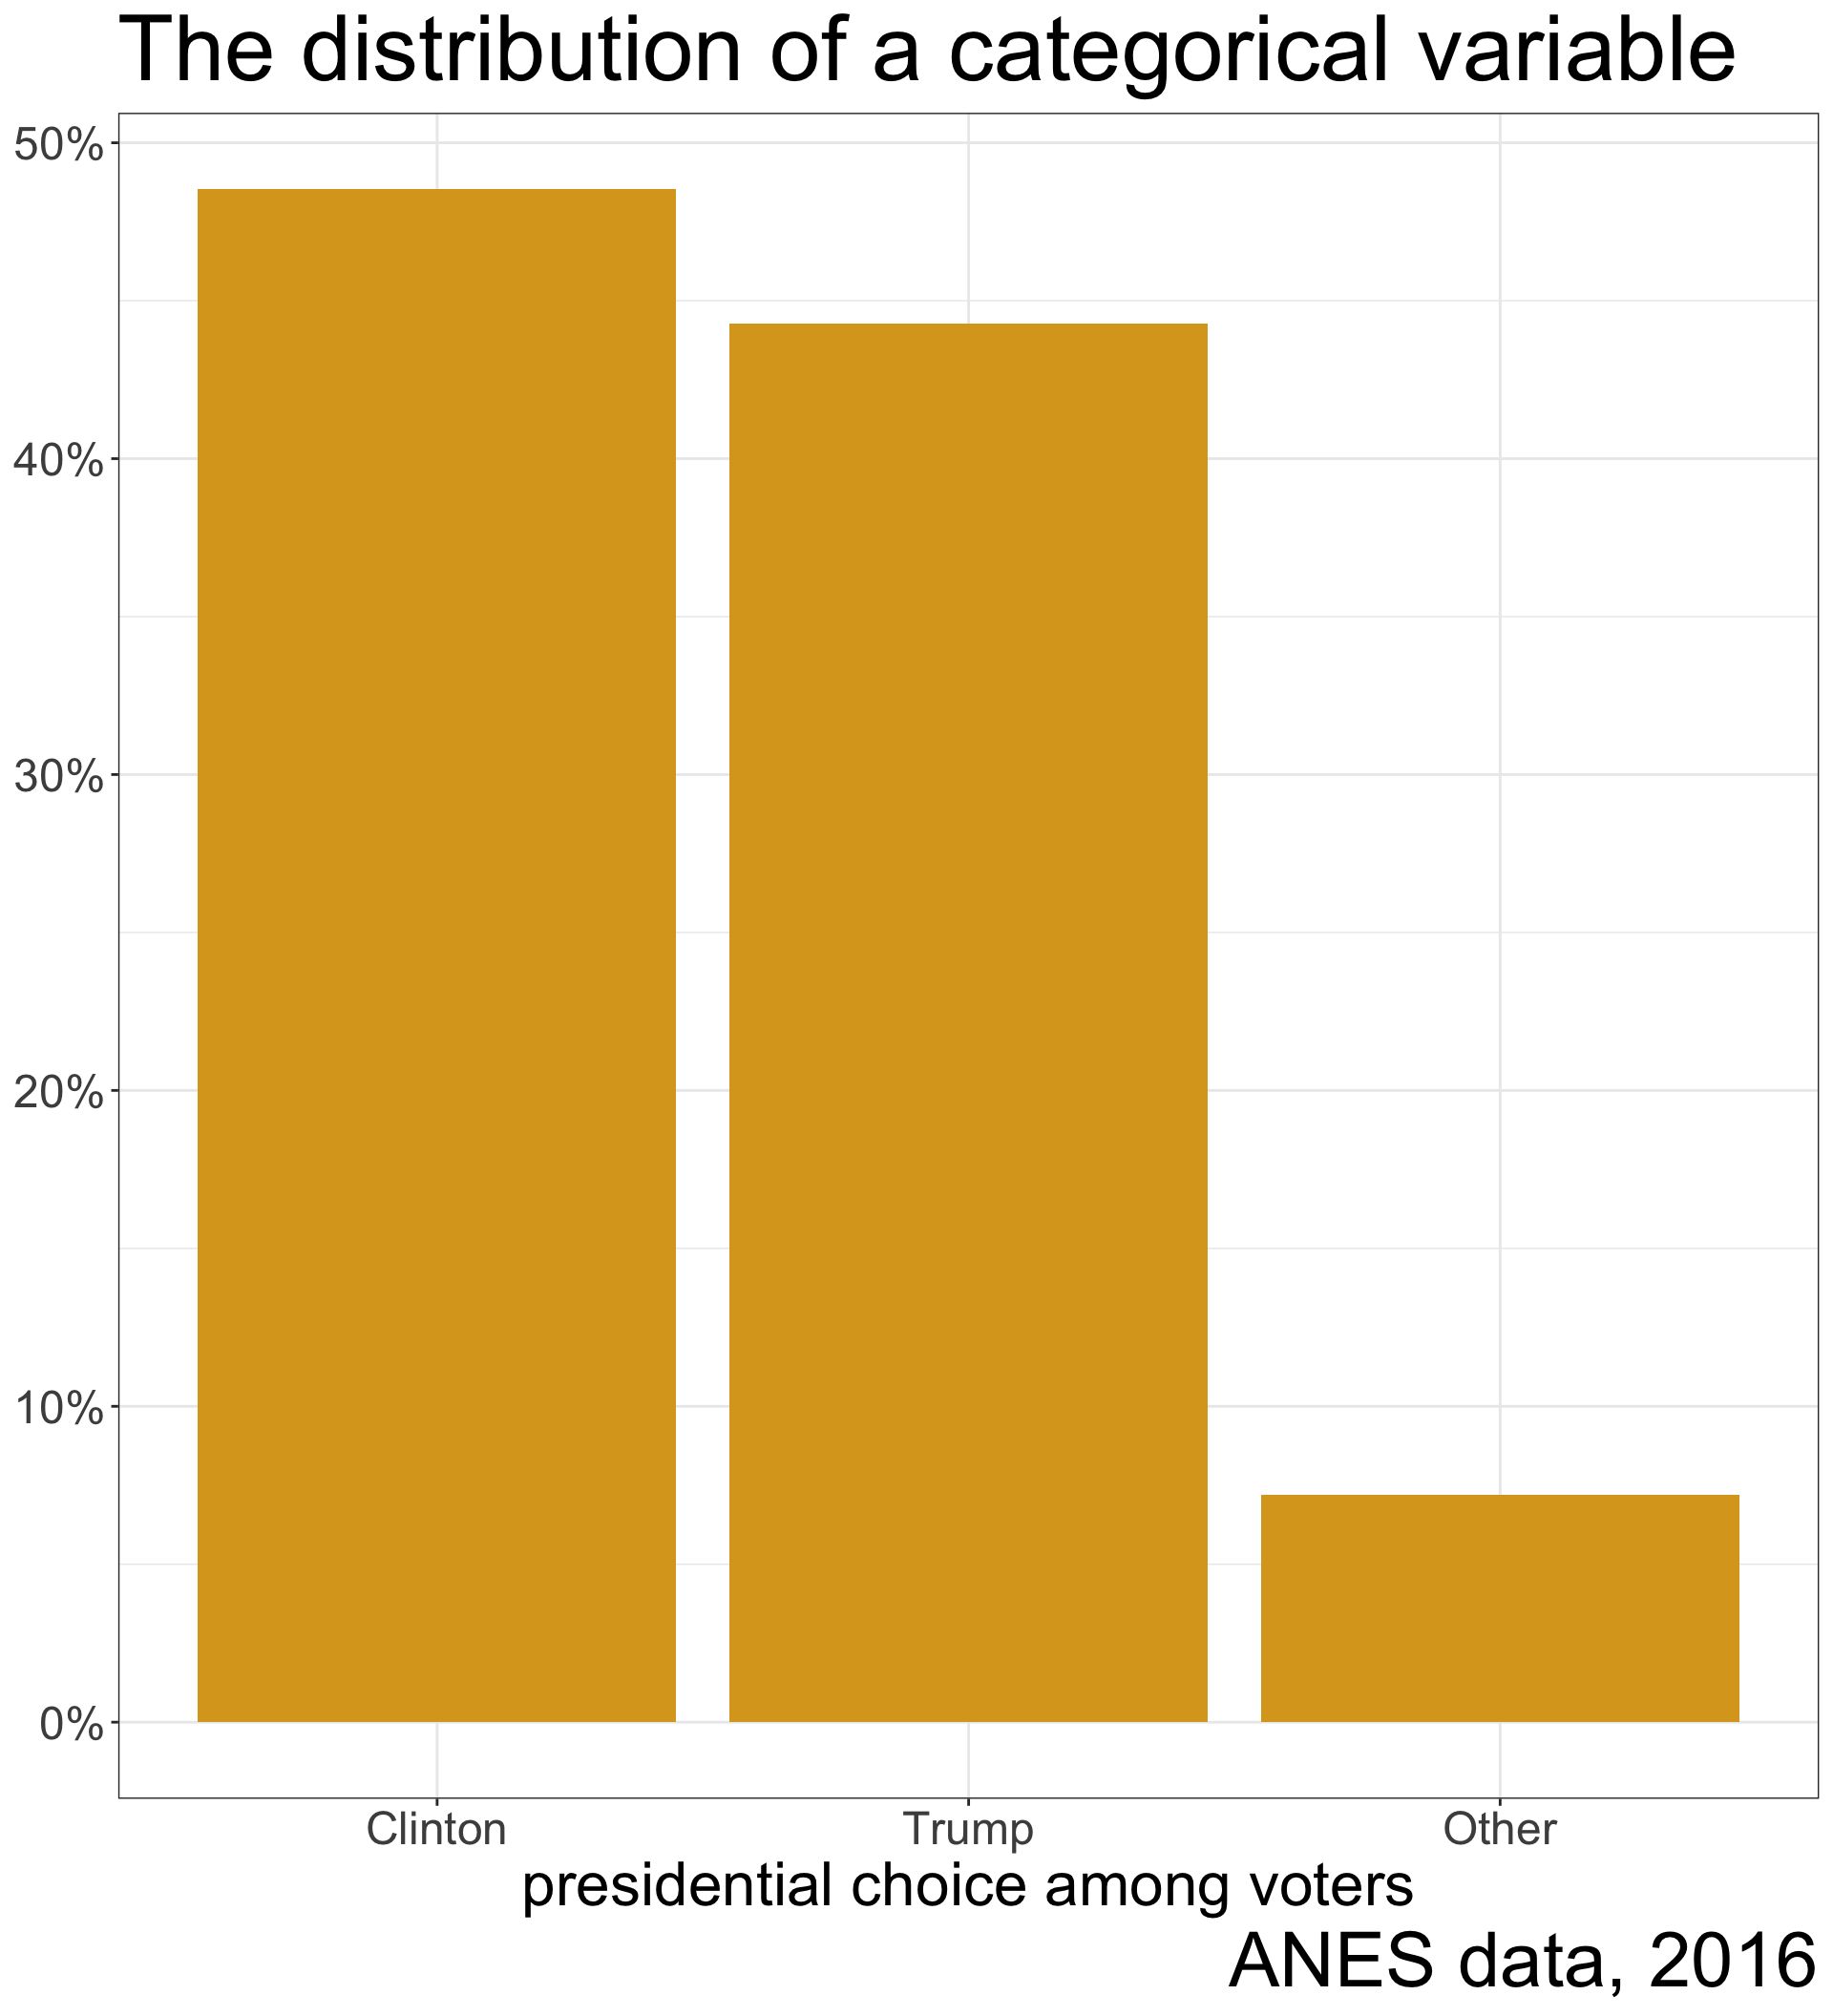
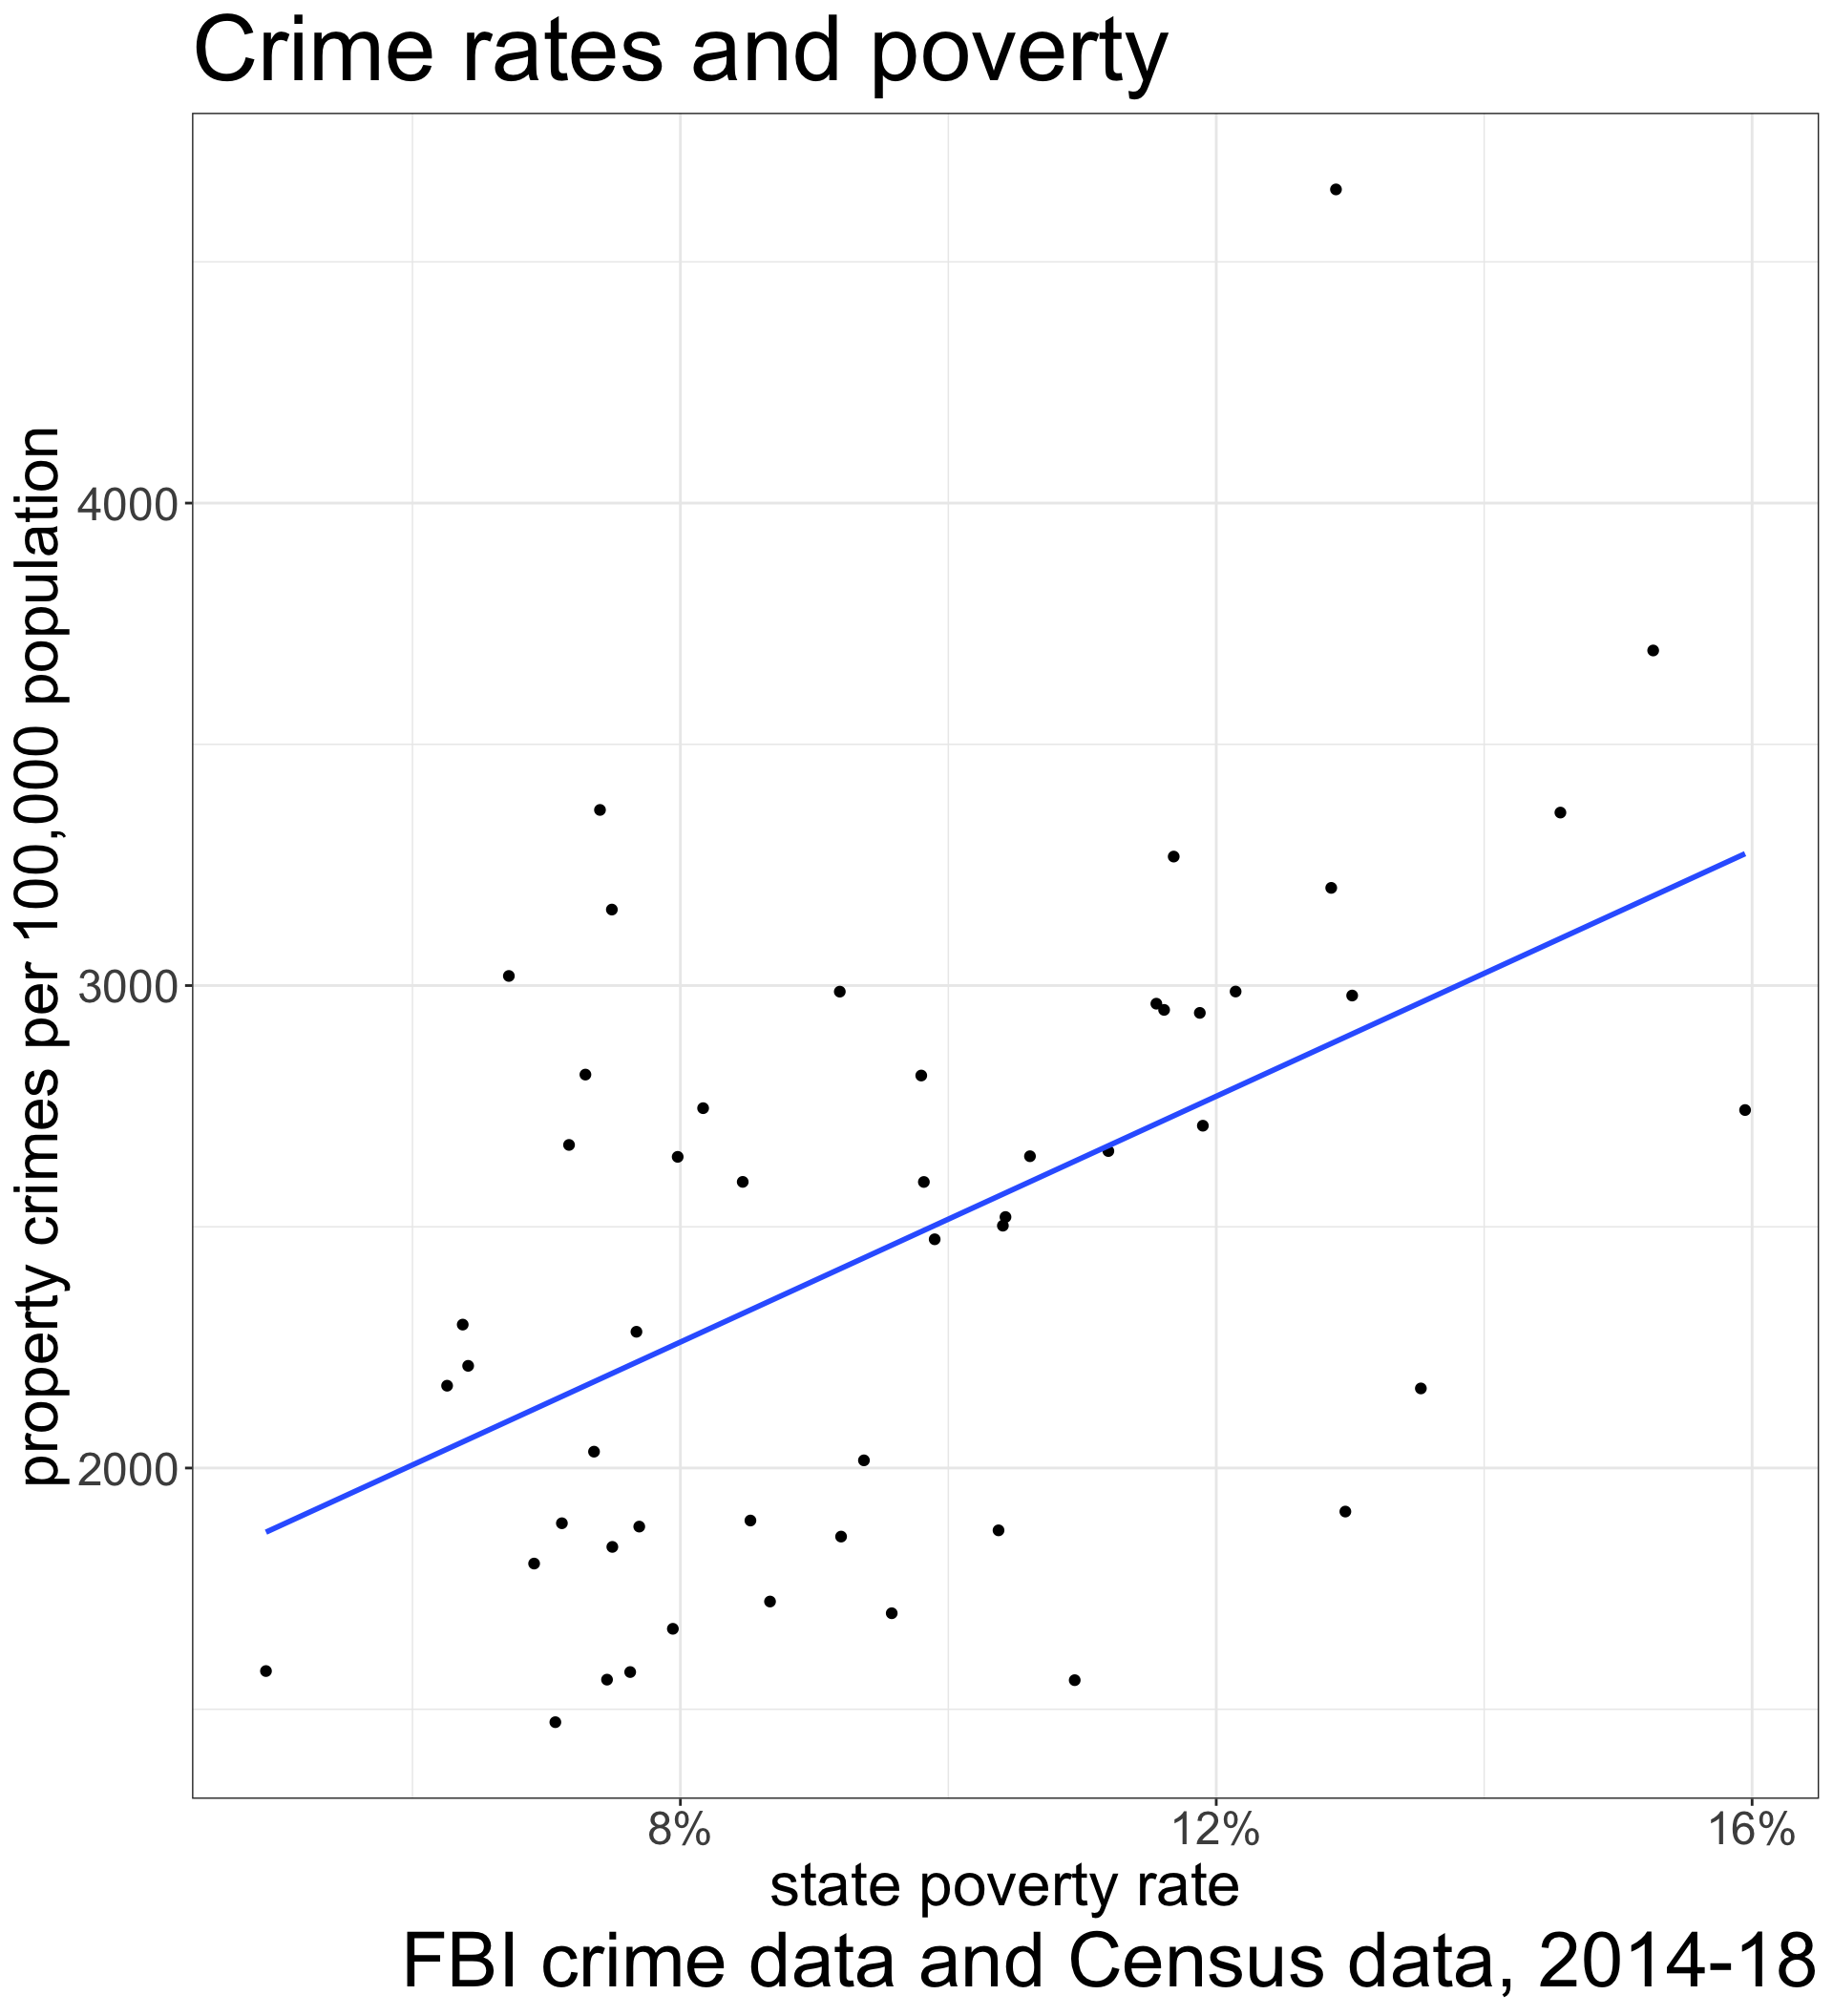
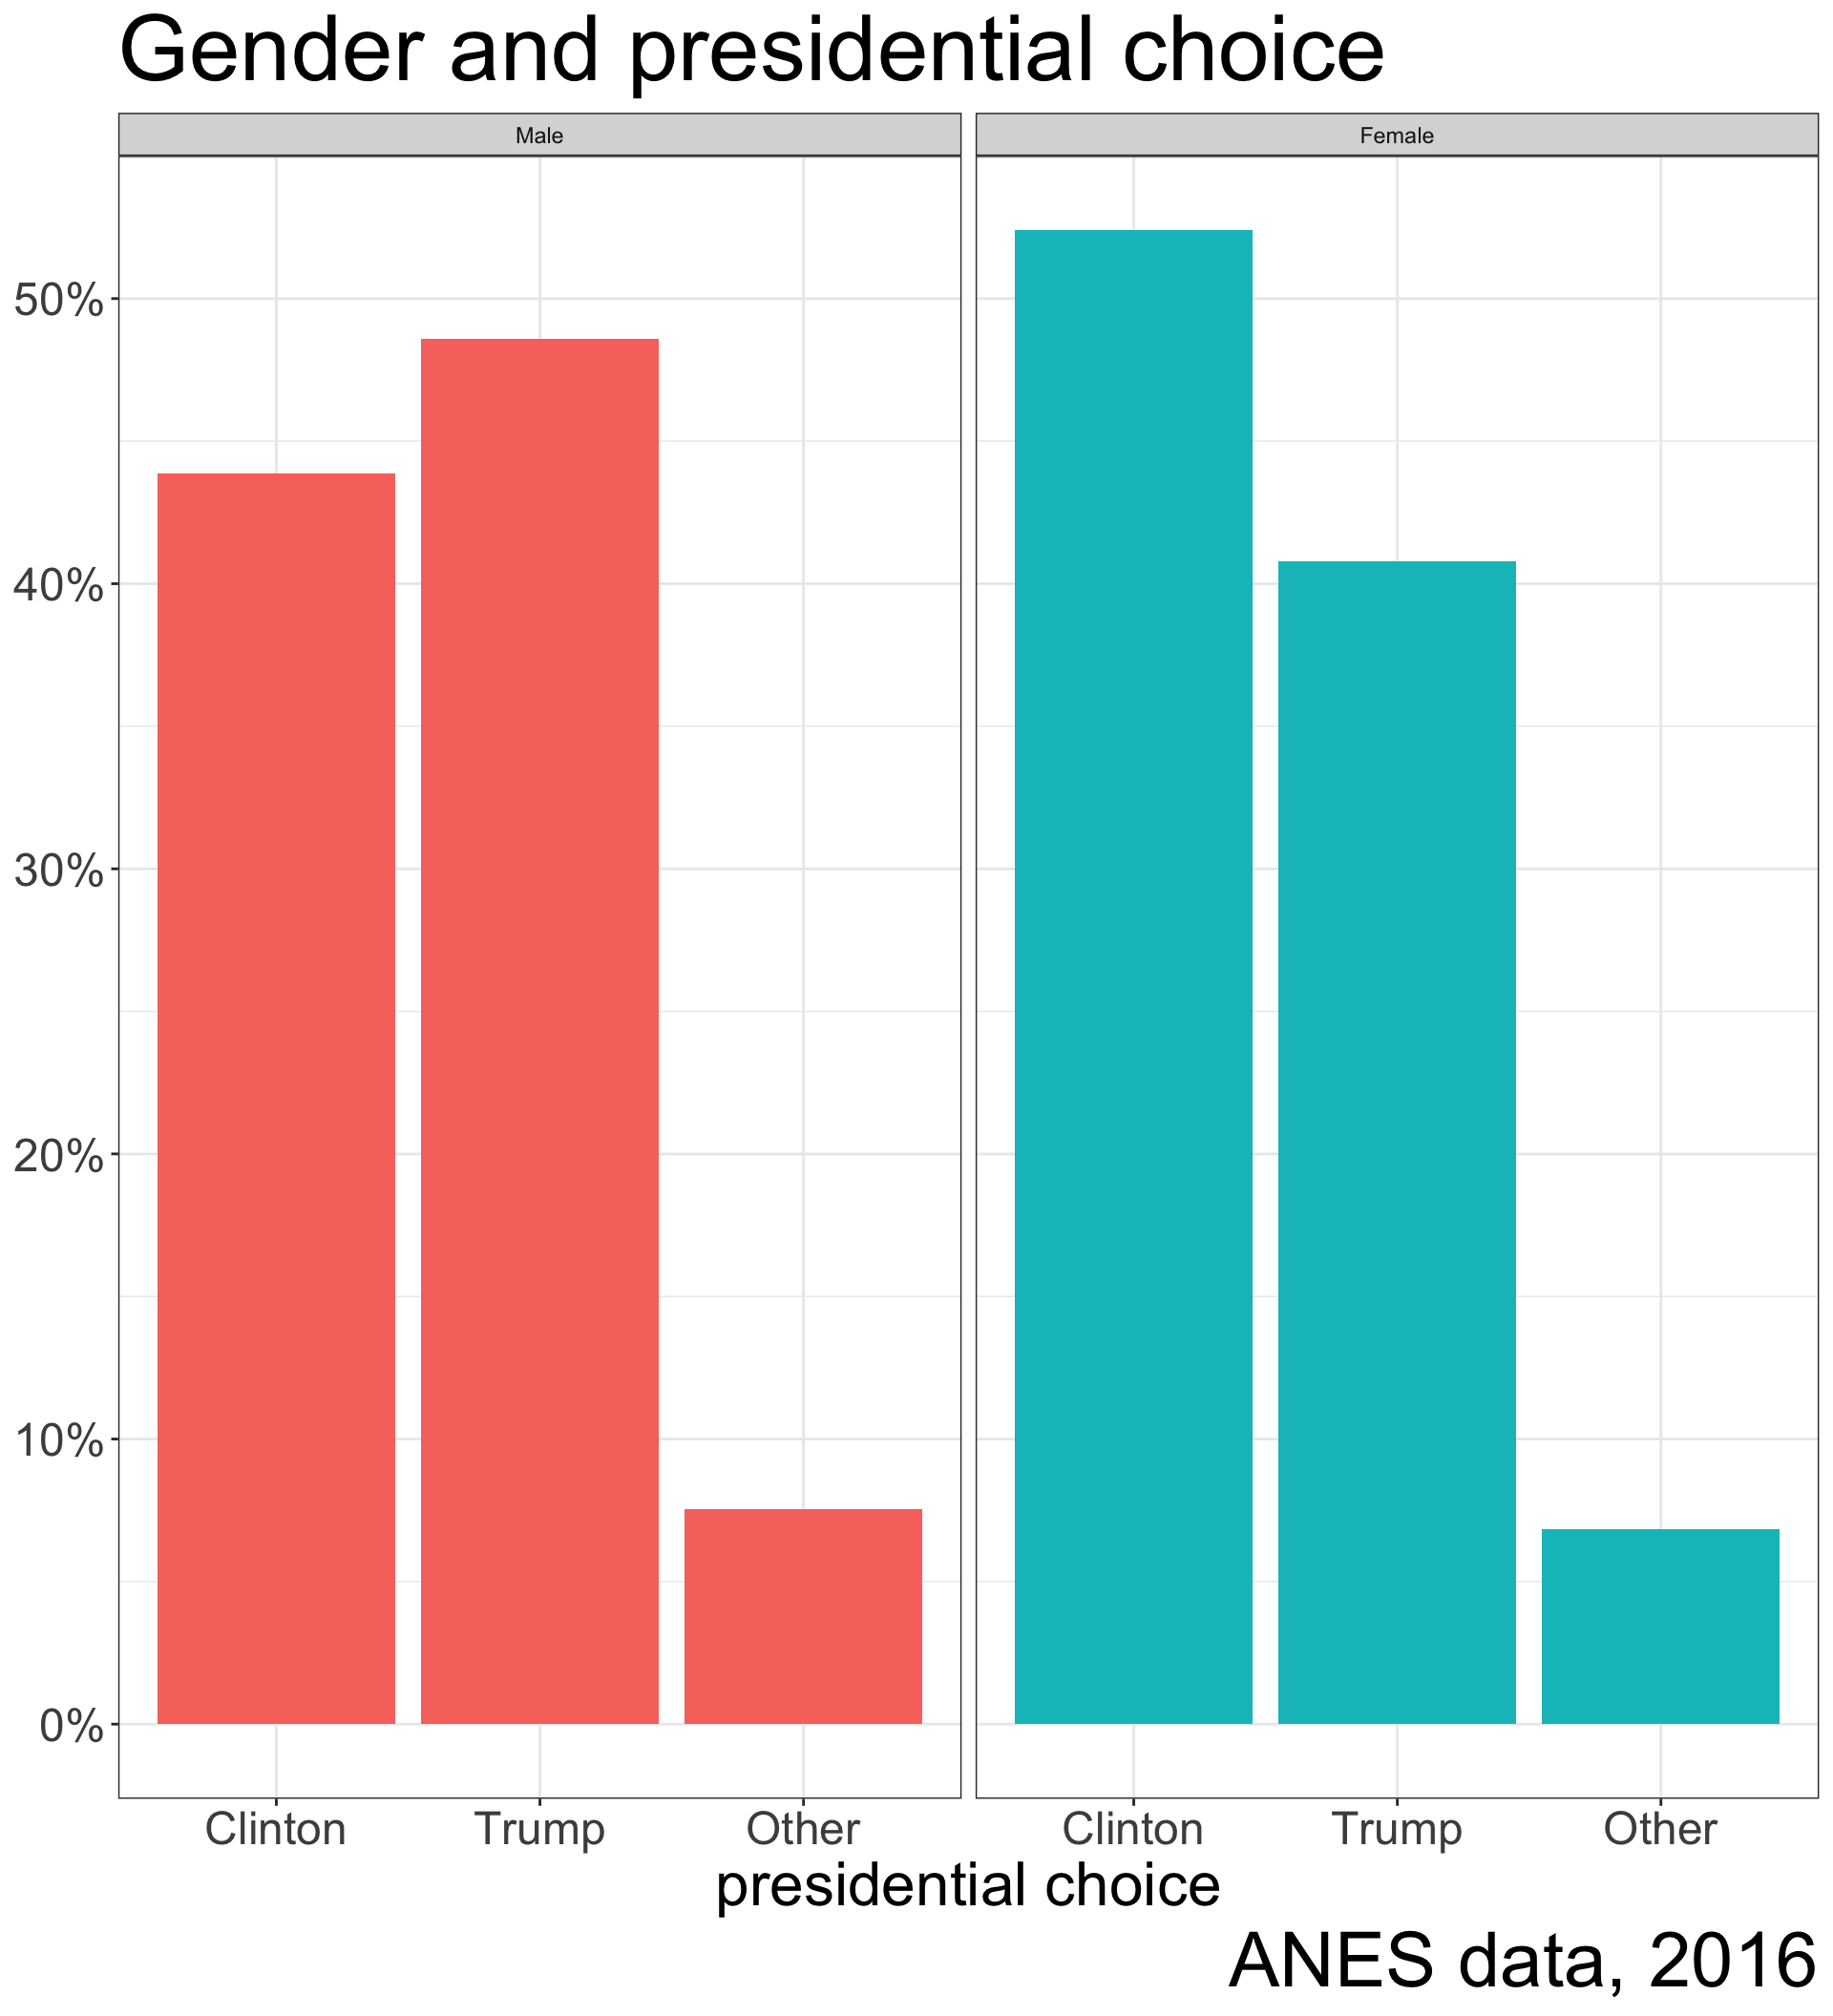
Look at association between variables
Make statistical inferences
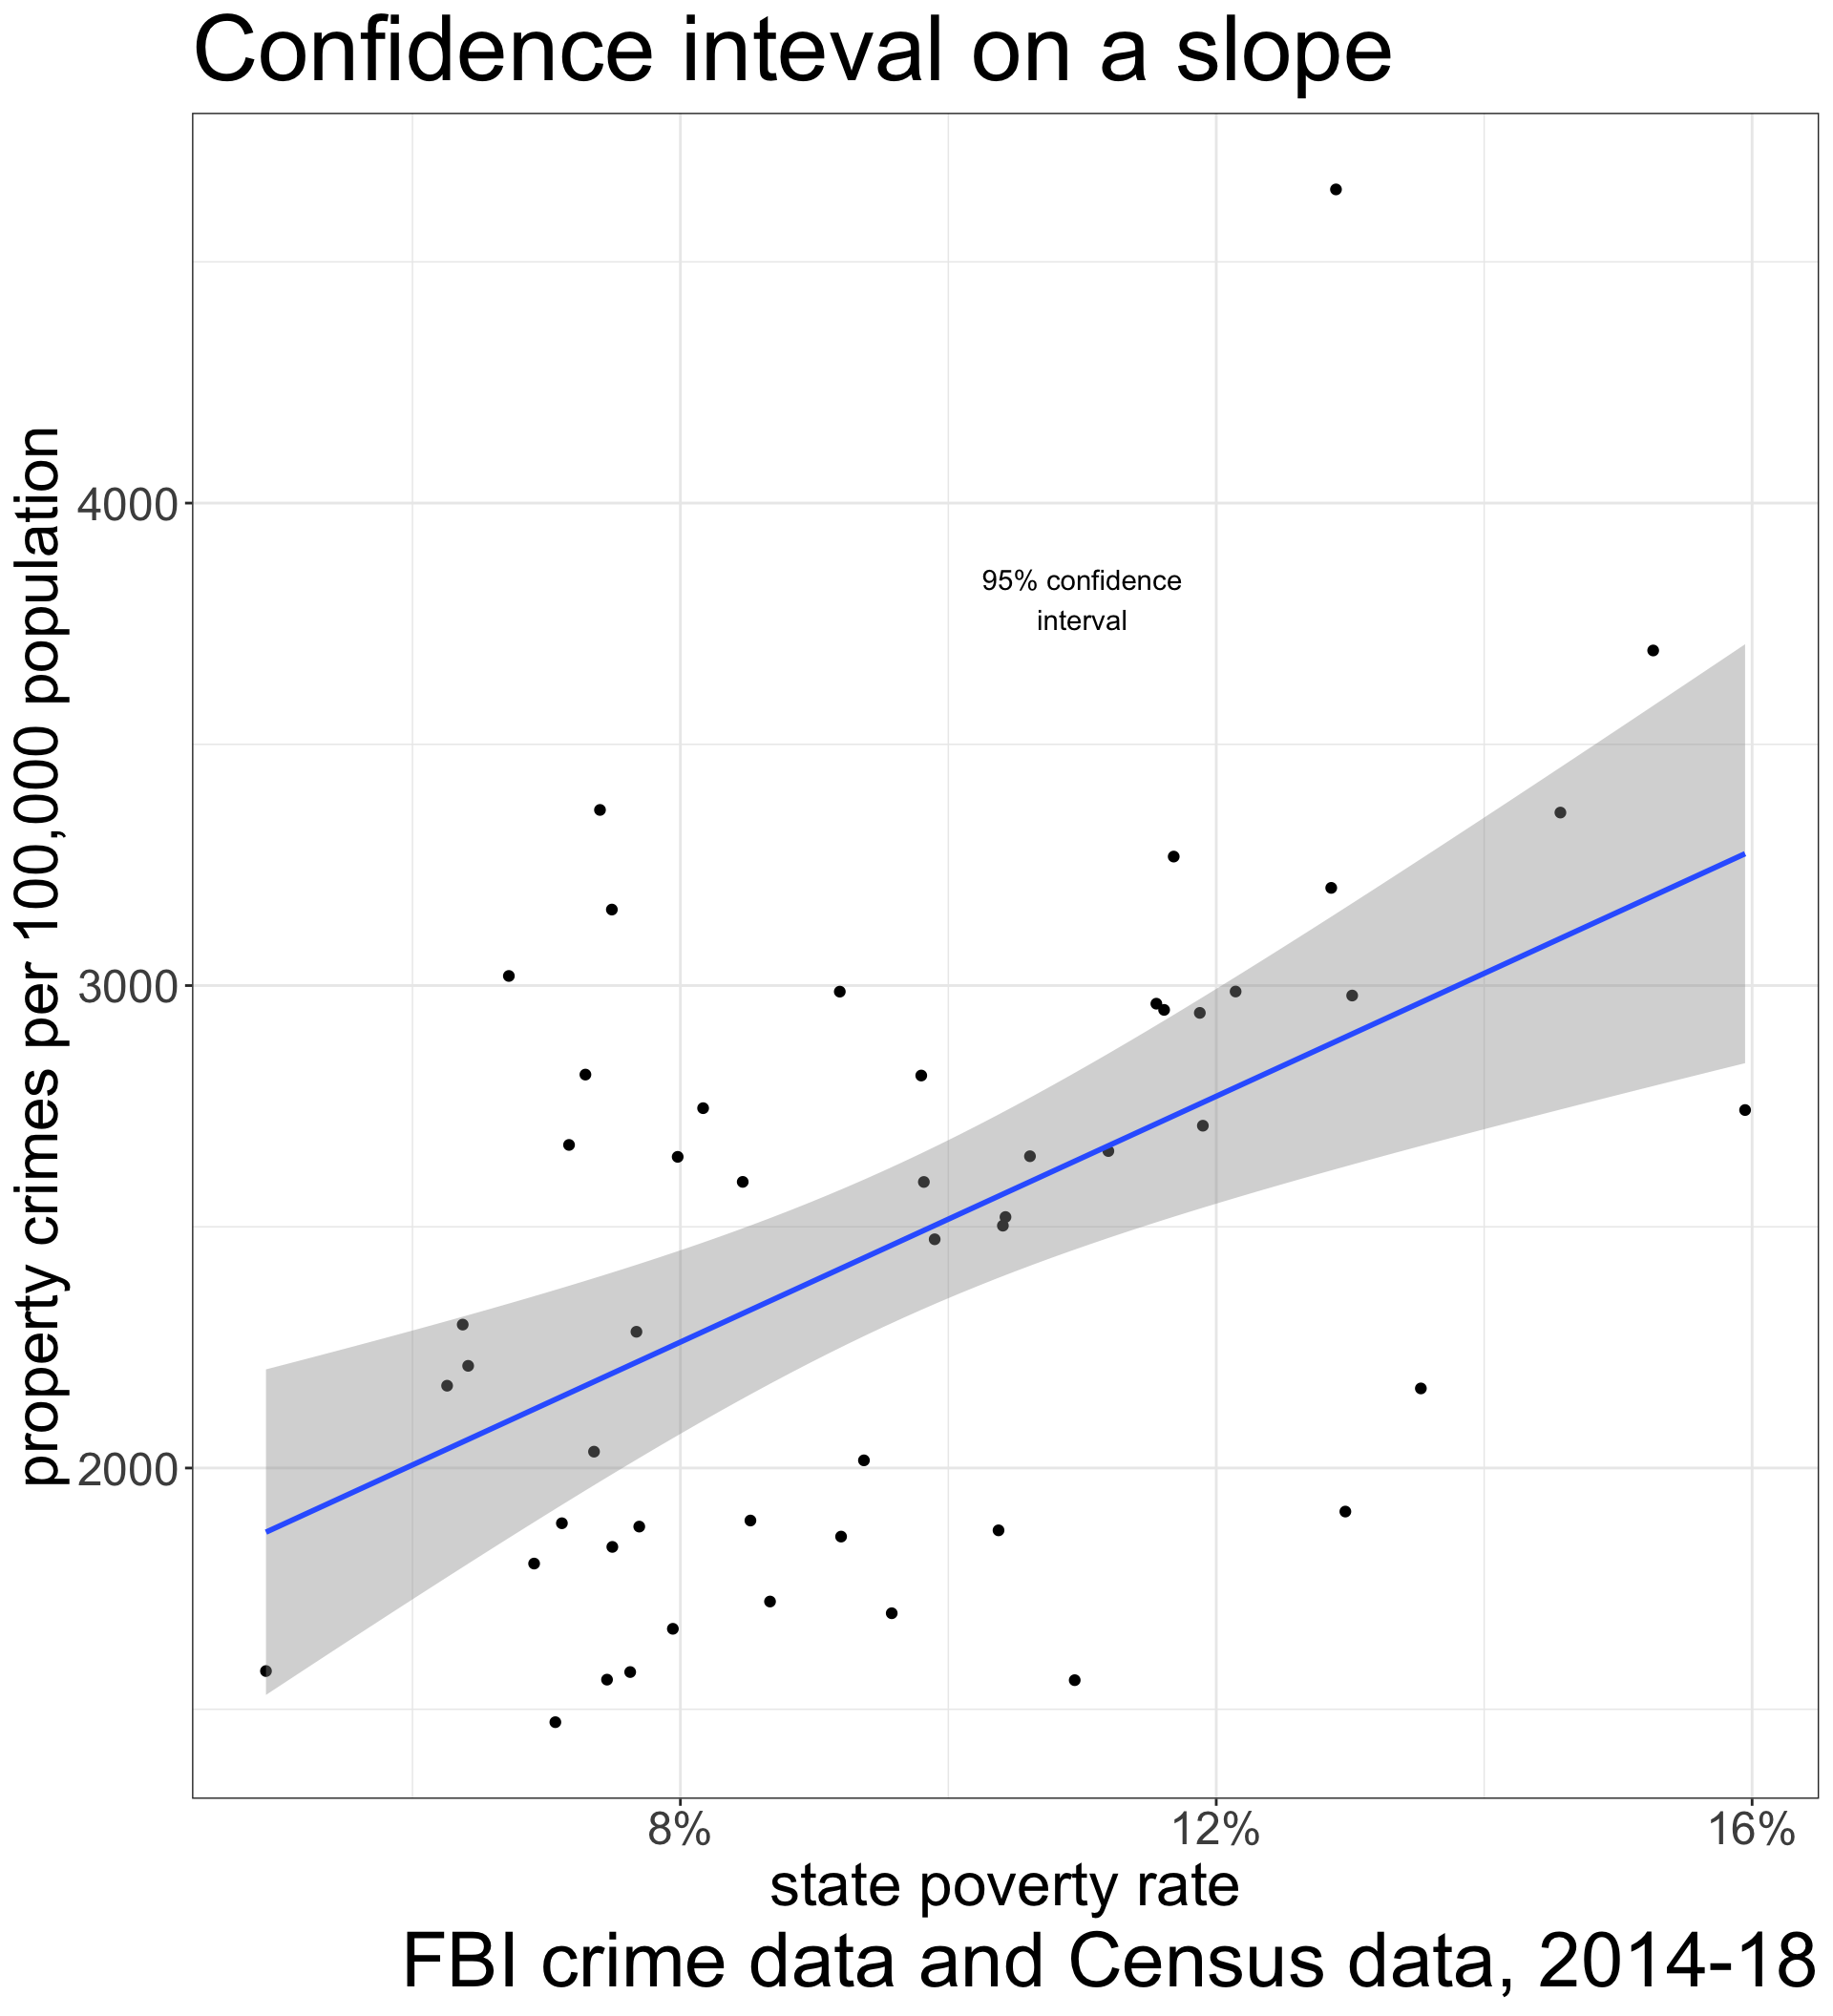
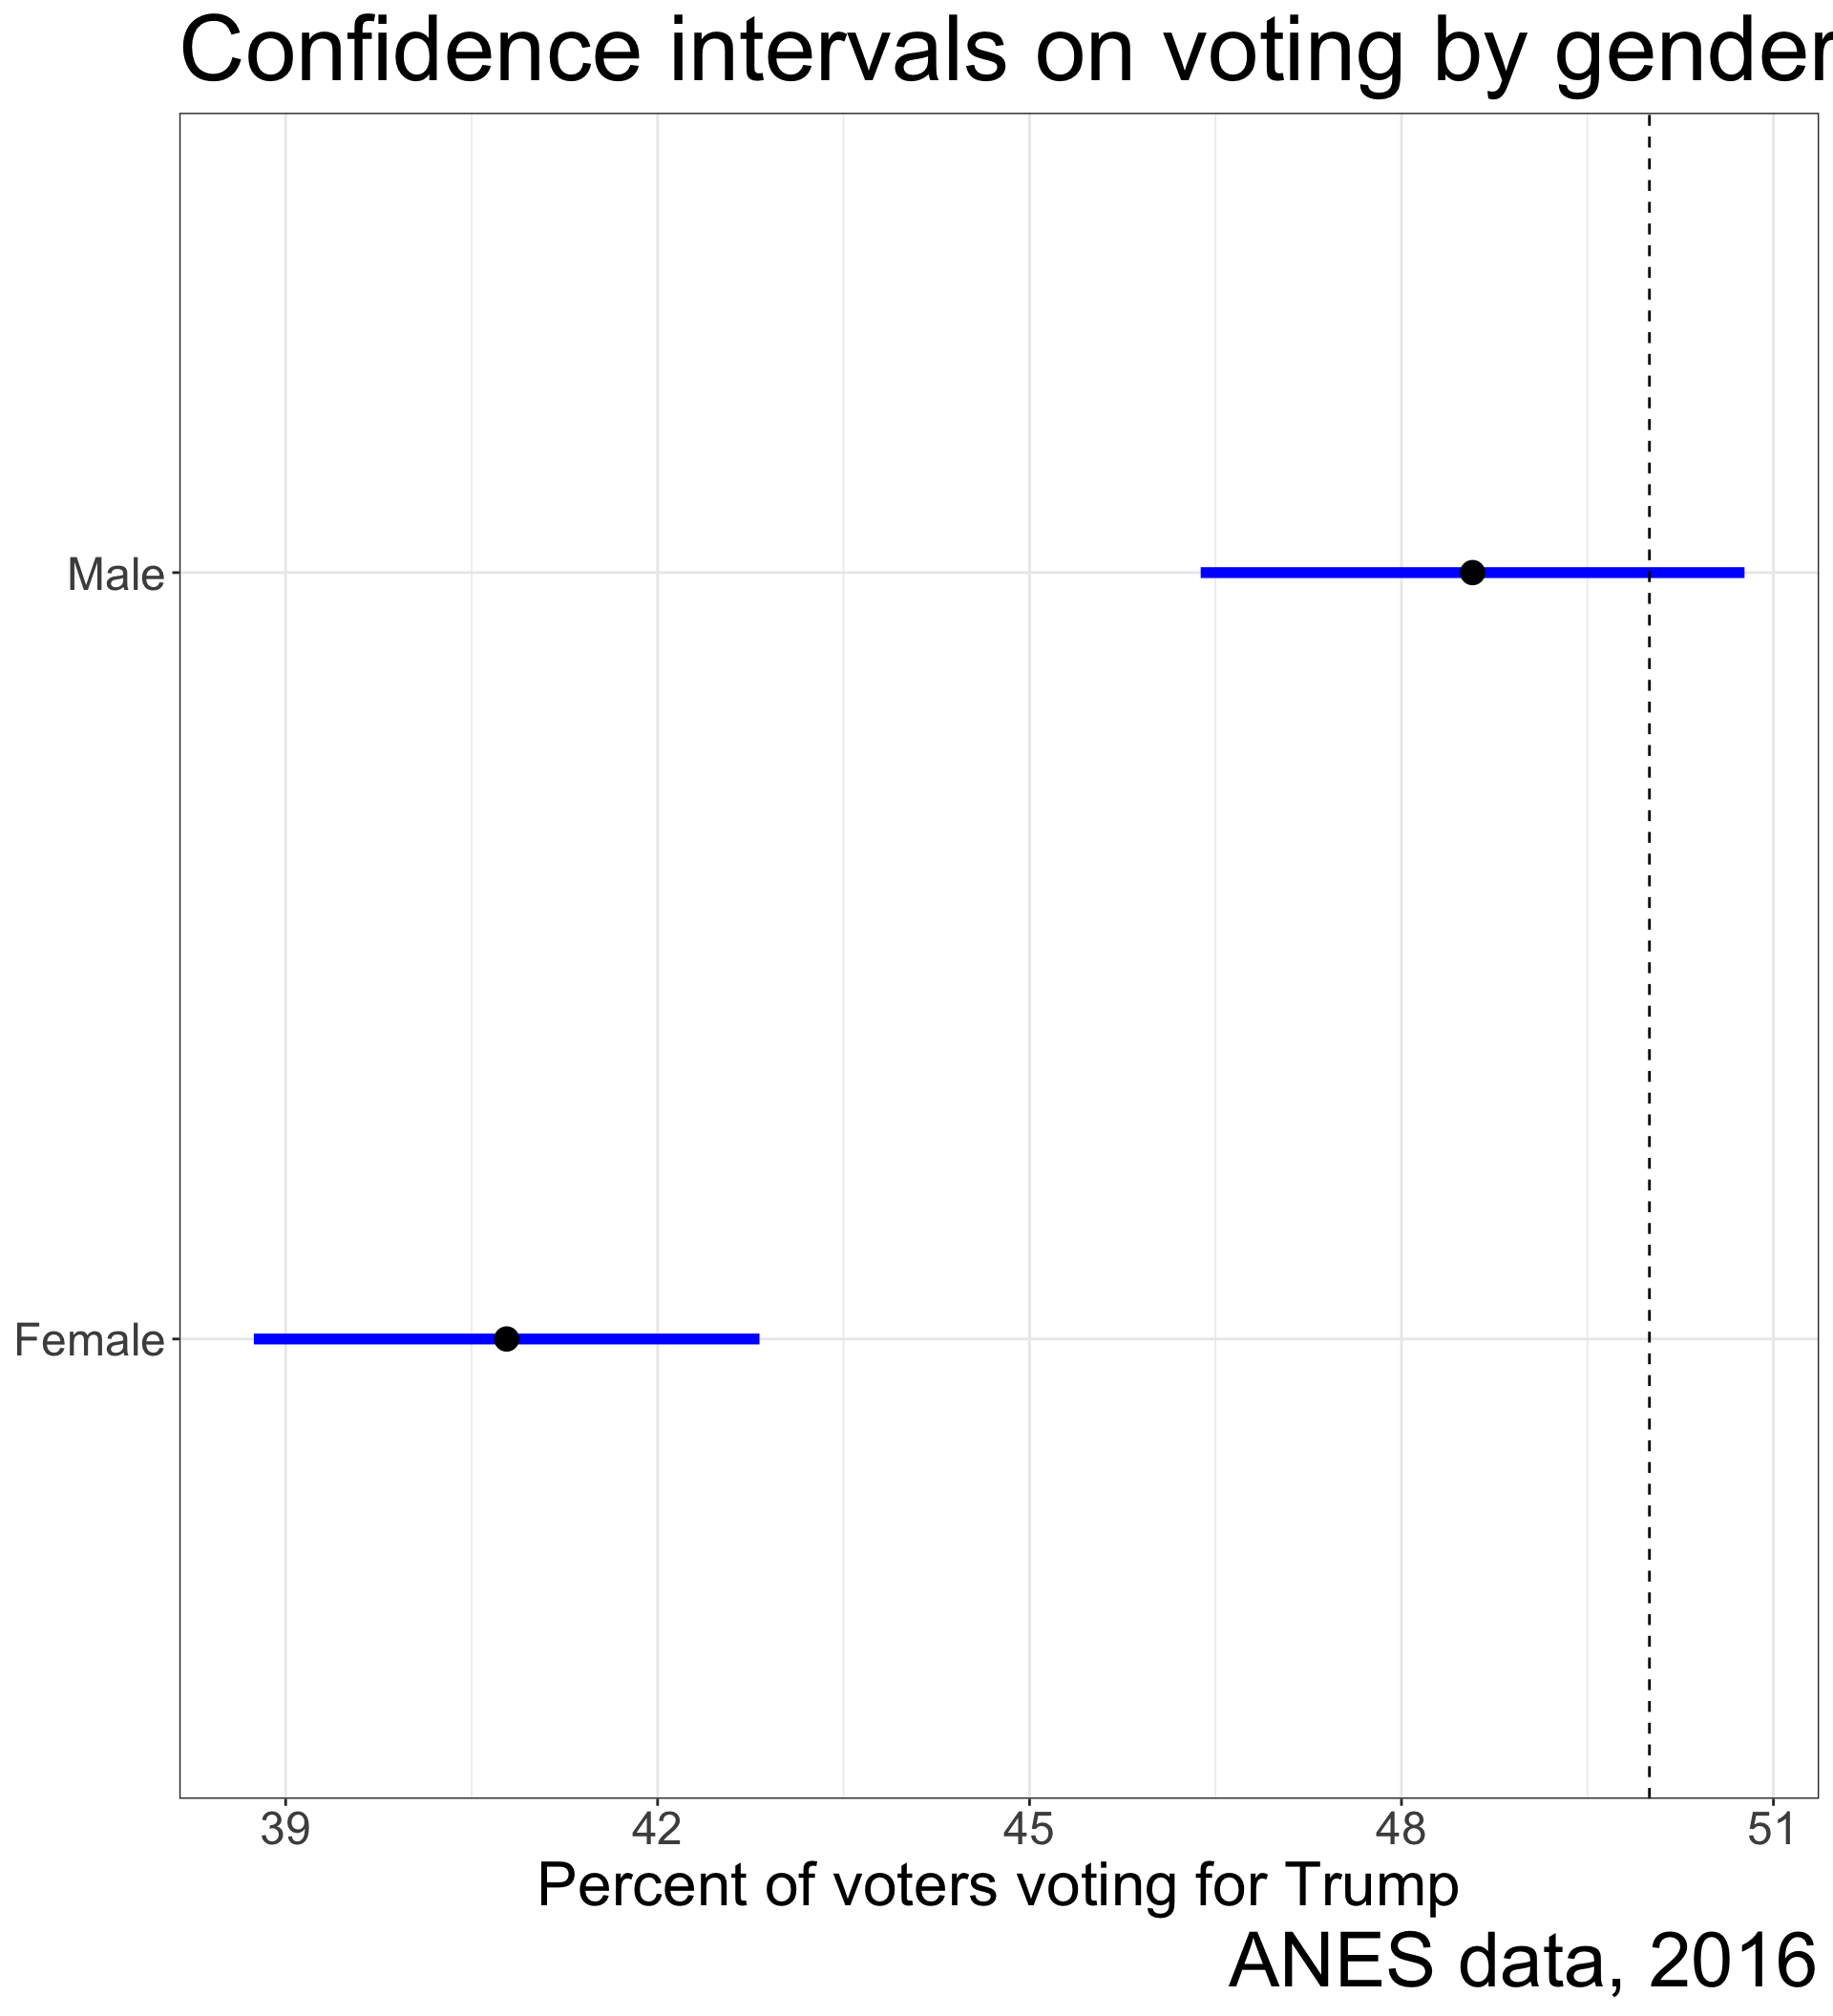
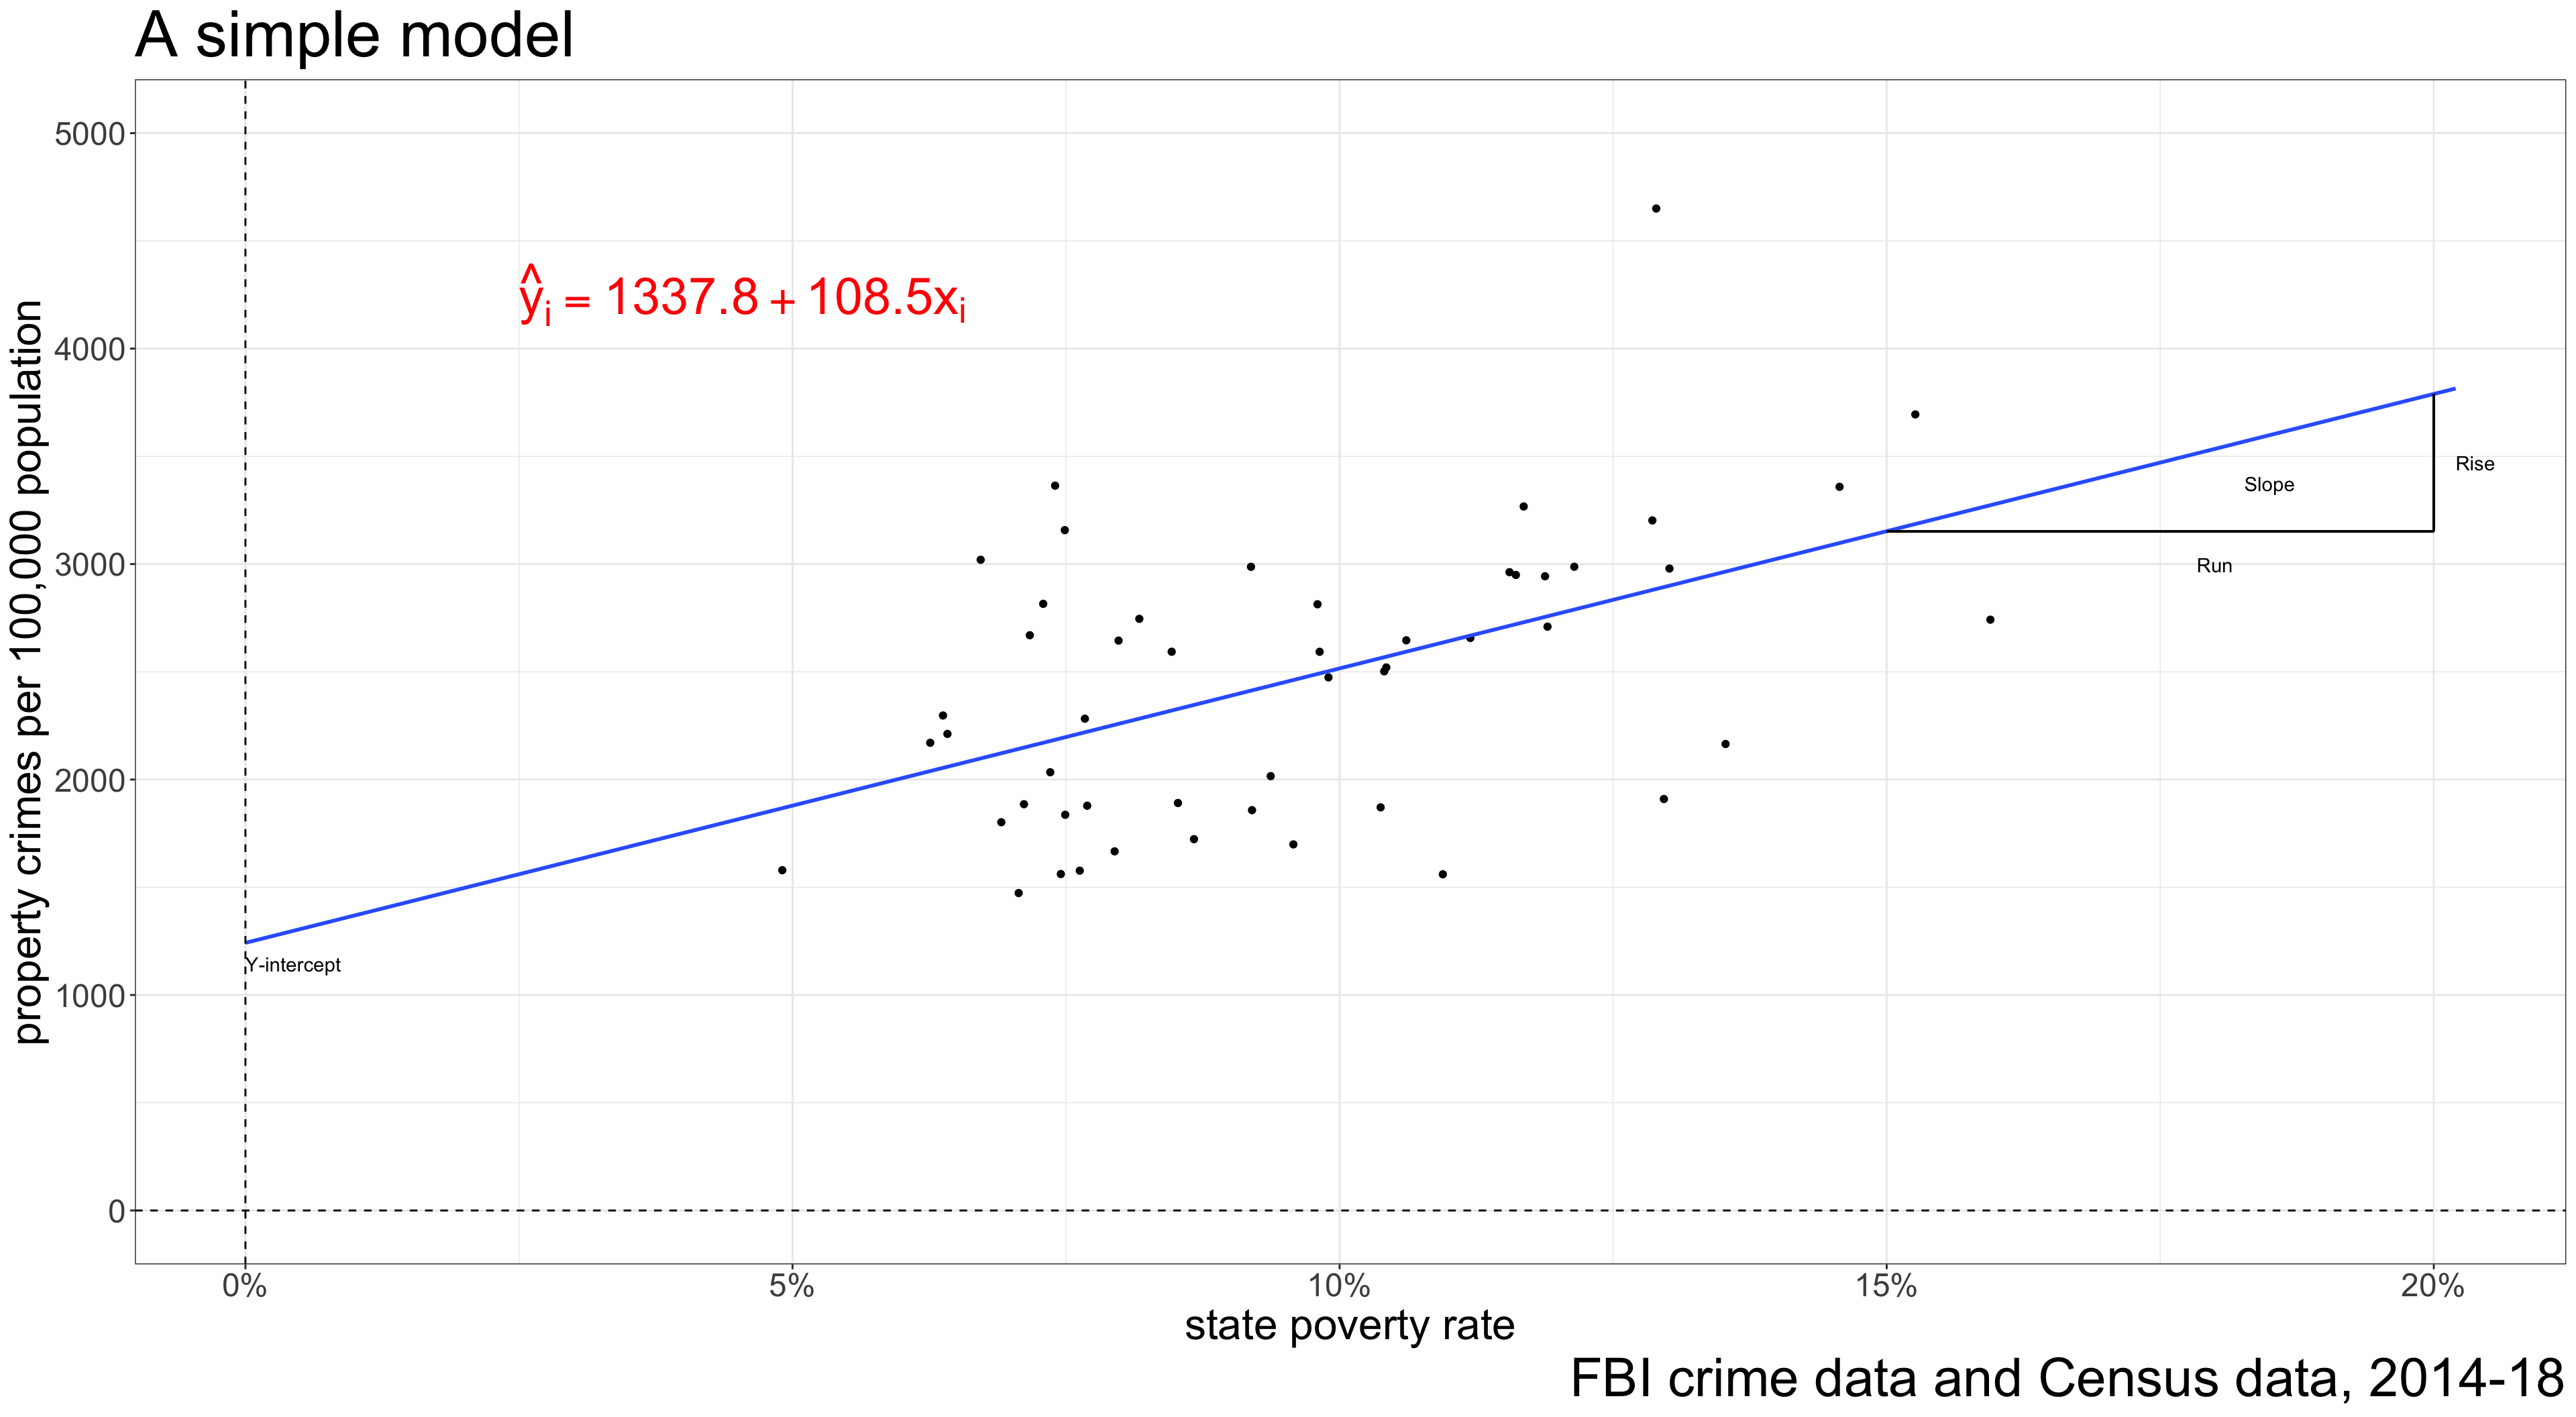
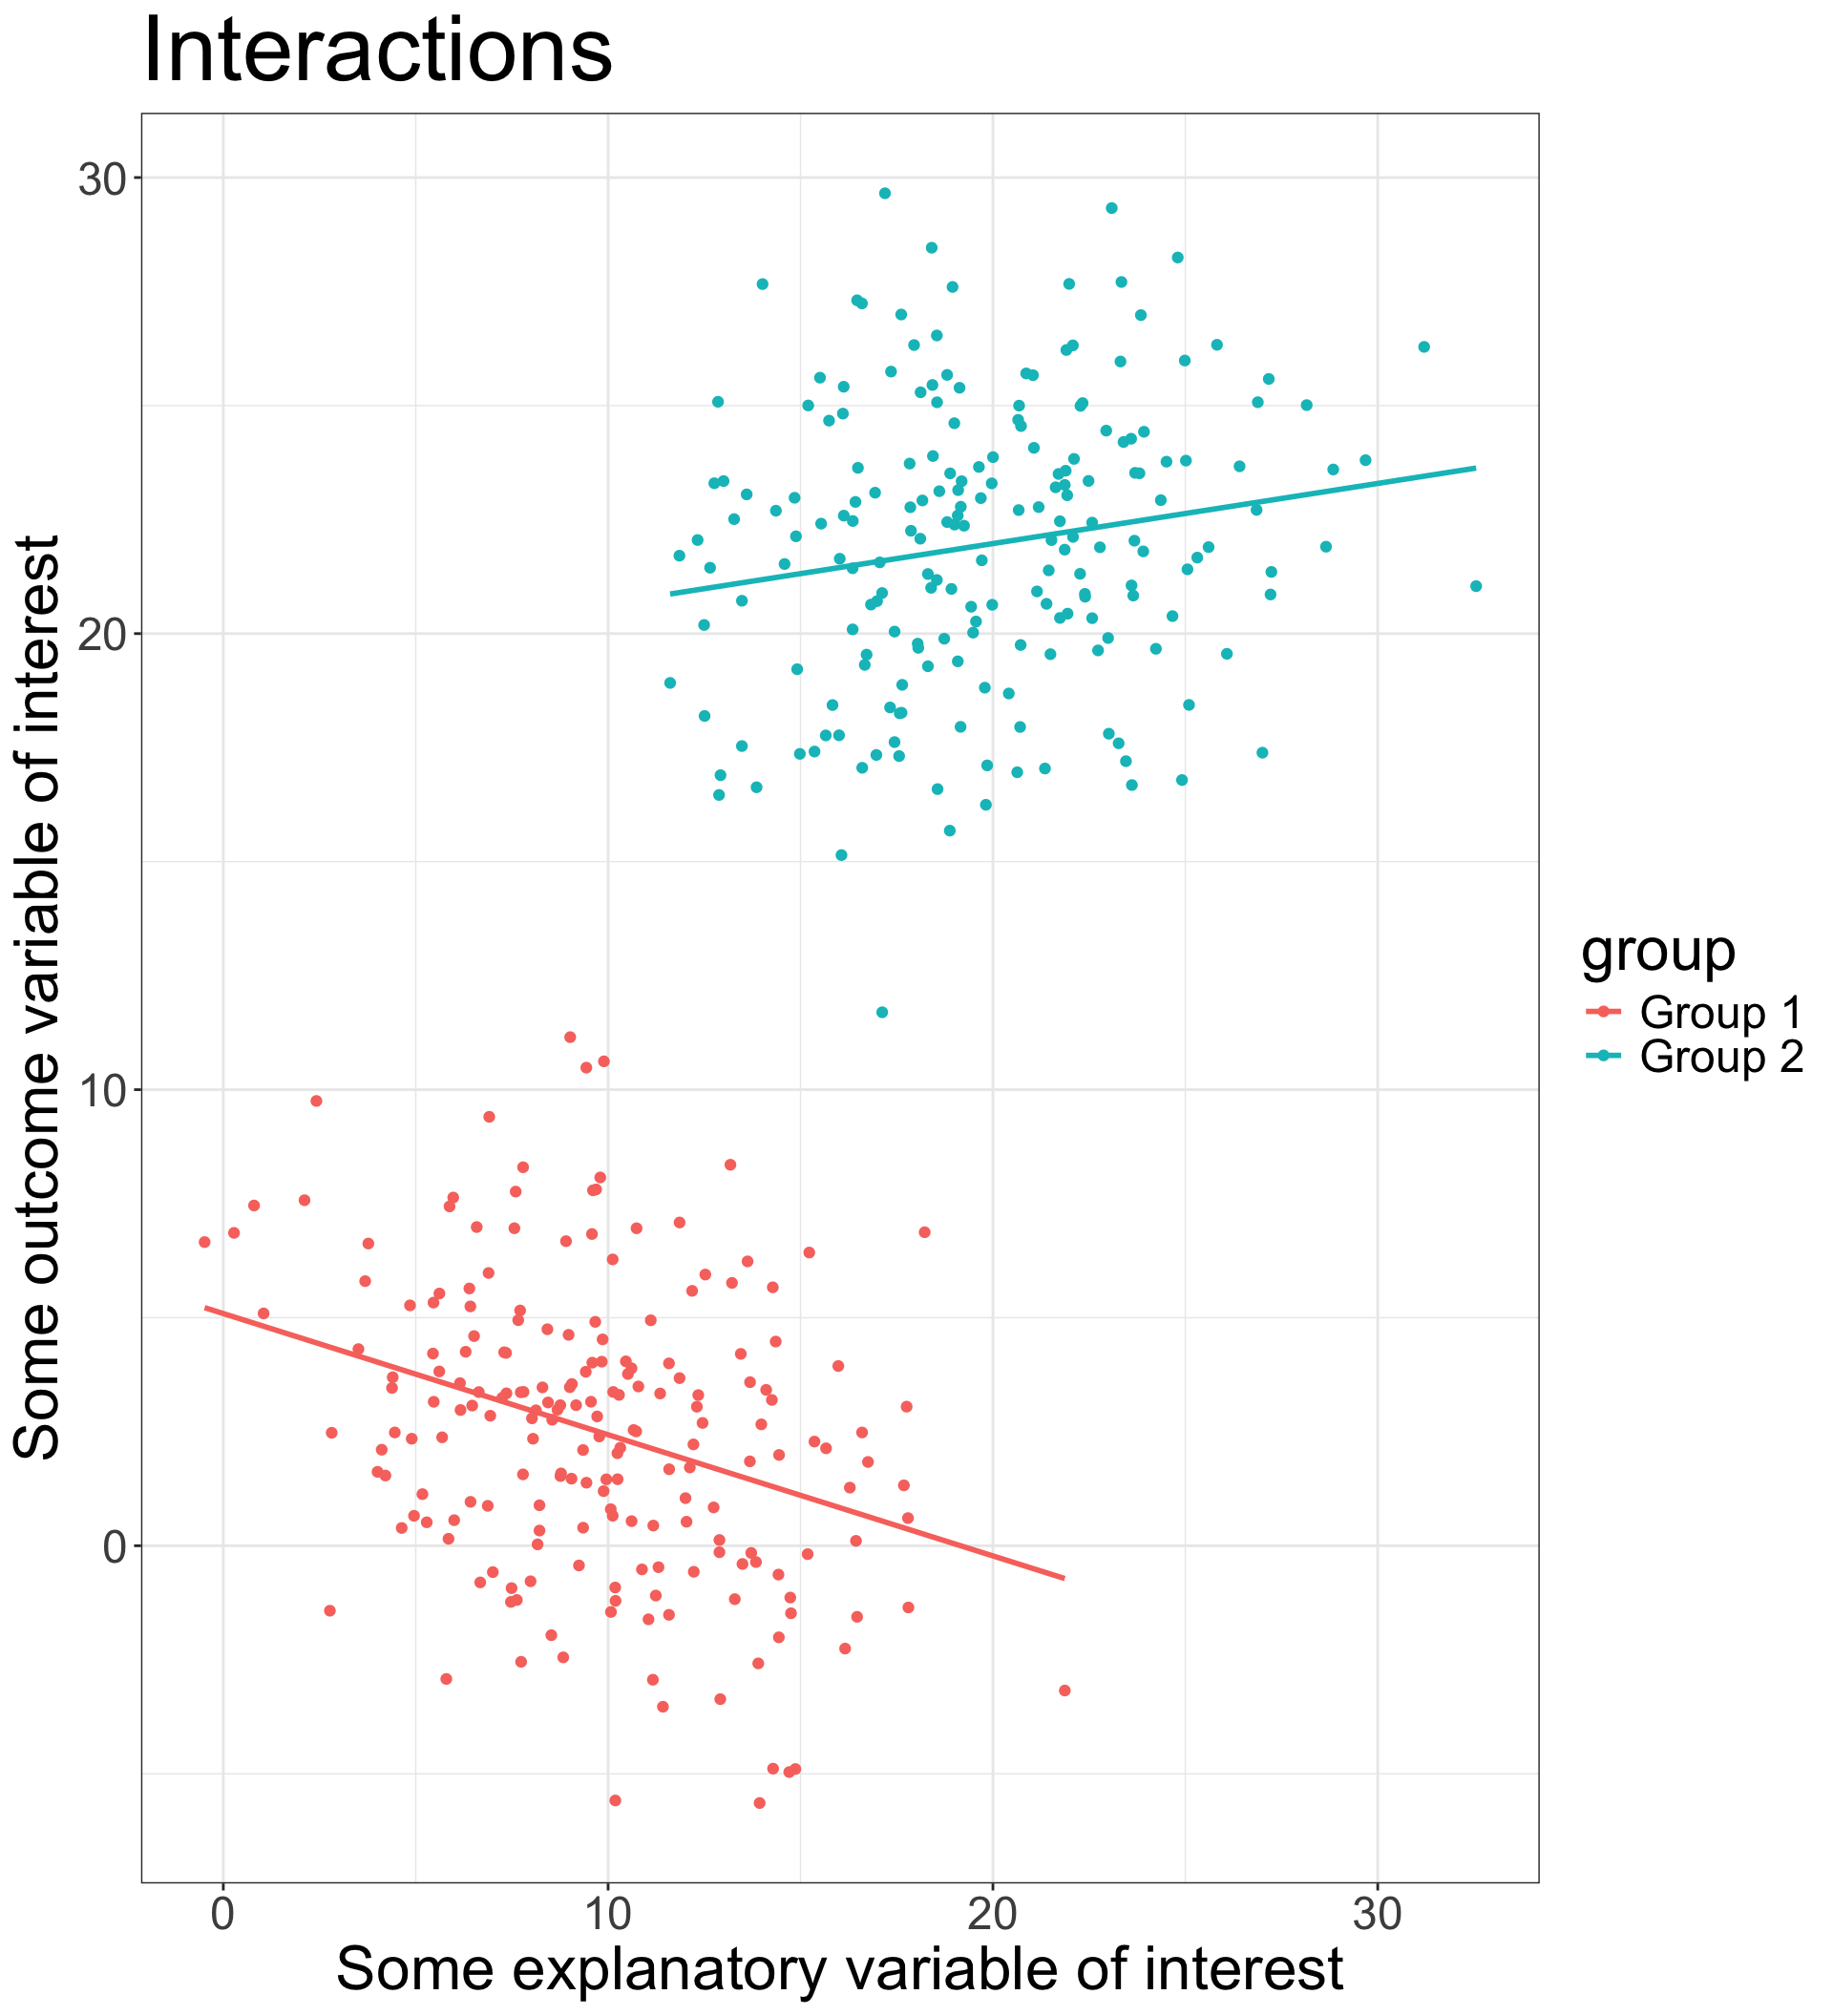
We can build models
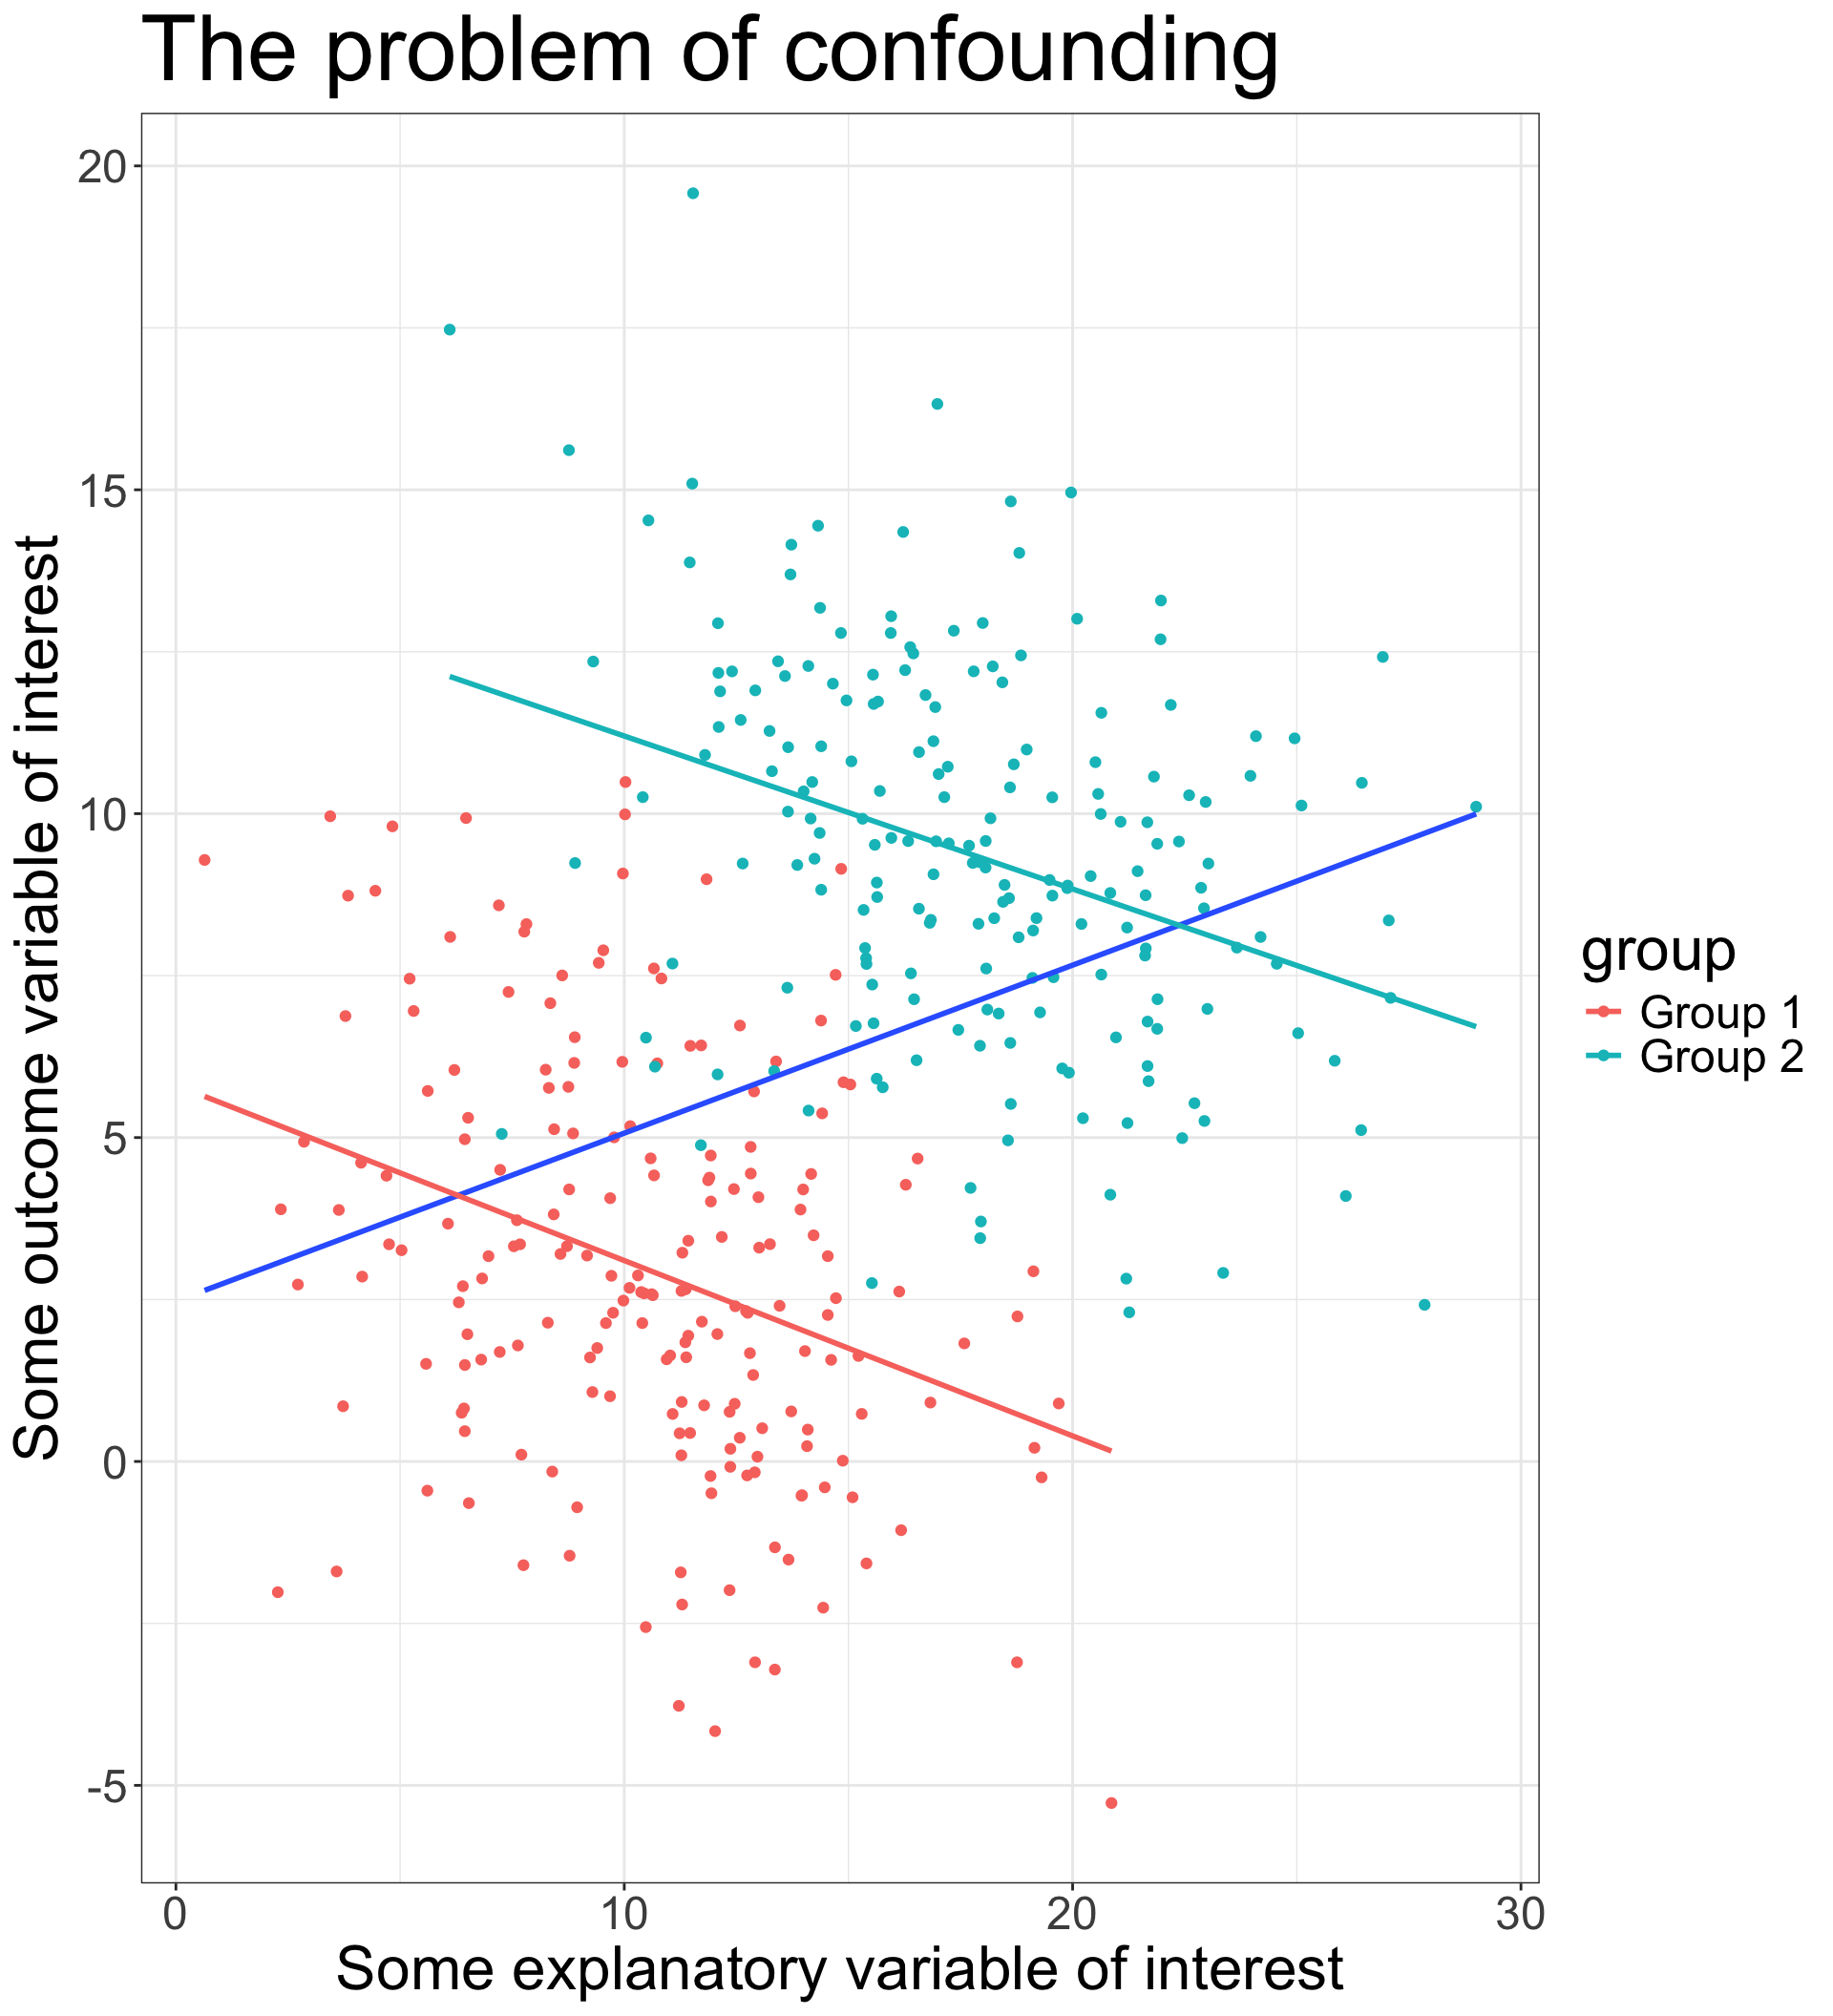
Models can get more complex
Two views on observational data
Most of the data we use in the social sciences is observational rather than experimental. We observe what actually happens rather than manipulate “treatments” in order to observe a response.
There are two different views of exactly what the use of statistics contributes to observational data analysis:
Pseudo-Experimental
- We use statistical modeling to try to mimic the stronger causal claims of experimental research.
- This can be as simple as “controlling” for other variables to mimic random assignment of a treatment, to the use of “natural” experiments.
Formal Description
- We use statistical modeling to describe what we observe in the data in a formal, systematic, and replicable way.
- We show how the data are either consistent or inconsistent with certain views of a social process as derived from theory.
Sociology 312/412/512, University of Oregon